The amazon vs flipkart india sellers debate isn't a brand preference it's a margin and strategy question. Amazon and Flipkart reward very different seller behaviours. A strategy that wins you the Buy Box on Amazon.in can actively hurt your ranking on Flipkart because their algorithms weigh seller competition, pricing behaviour, and fulfilment speed differently.
What Does the Amazon vs Flipkart Battle Actually Mean for Indian Sellers?
The amazon vs flipkart india sellers debate isn't just a business-school case study. It's a real decision that affects your commission structure, Buy Box win rate, search traffic, and ultimately how much profit lands in your account at month-end.
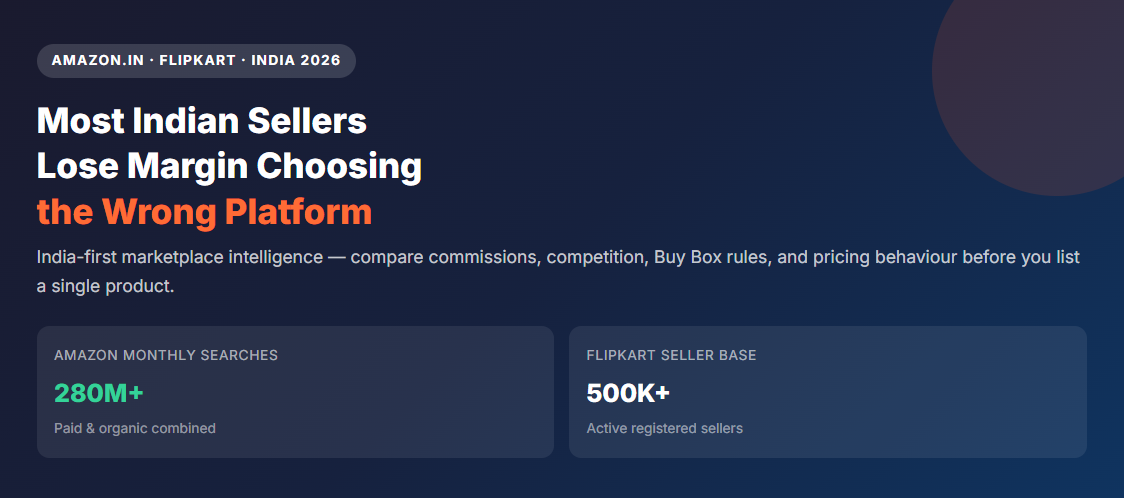
Both platforms are behemoths. Amazon.in handles over 280 million monthly product searches. Flipkart, backed by Walmart, commands 60–70% of fashion sales and dominates Tier-2 and Tier-3 city shoppers. They are the primary drivers of e-commerce in India. The problem? Most sellers list on both platforms the same way, with the same pricing, the same strategy and then wonder why margins keep shrinking.
This guide cuts through the noise. We compare both platforms across the metrics that actually move the needle for Indian SMB sellers: commission fees and seller competition, search traffic, Buy Box mechanics, and pricing dynamics with a final verdict for each category type. For sellers already running both platforms, pair this with our competitor price tracking feature to close the intelligence gap between the two marketplaces.
Commission Fees: Where Does Your Margin Actually Go?
Commission fees are the most direct cost comparison and the gap between Amazon and Flipkart is larger than most sellers realise.
| Category | Amazon.in Commission | Flipkart Commission | Winner |
|---|---|---|---|
| Electronics | 5–8% | 5–7% | Tie |
| Fashion / Apparel | 10–17% | 7–12% | Flipkart ✓ |
| Home & Kitchen | 8–12% | 10–15% | Amazon ✓ |
| Books & Media | 15–18% | 10–14% | Flipkart ✓ |
| Beauty & Personal Care | 10–14% | 8–13% | Flipkart ✓ |
| Sports & Fitness | 10–15% | 9–13% | Flipkart ✓ |
| Toys & Baby | 10–14% | 9–12% | Flipkart ✓ |
| Average Across Categories | ~11% | ~9% | Flipkart ✓ |
The 2% average commission difference may sound small. On a ₹1,000 product selling 500 units per month, that's ₹10,000/month in pure margin compounding across your entire SKU catalogue.
Commission fees are just one cost layer. Amazon charges higher fulfilment (FBA) fees in some tiers, while Flipkart's Flipkart Fulfilment (FF) pricing is more competitive for sellers outside metro warehouses. Always model the total cost not just the commission rate.
Search Traffic: Which Platform Sends More Buyers?
Amazon.in generates approximately 2.4× more organic product search traffic than Flipkart. This isn't just about volume it's about buyer intent. Amazon shoppers are more likely to be in purchase mode, using specific search queries tied directly to product names, ASINs, and specifications.
Amazon's Search Advantage
Amazon.in's search algorithm, A9, prioritises conversion rate, relevance, and pricing competitiveness. Sellers with strong keyword targeting and competitive prices get disproportionate organic visibility. The platform also benefits from Google Shopping integrations, which drive significant search traffic from external sources. Sellers looking to maximise this advantage should read our guide on Amazon keyword research for Indian sellers.
Flipkart's Audience Strengths
Flipkart's traffic is geographically different. It over-indexes on Tier-2 and Tier-3 cities Patna, Indore, Jaipur, Surat where smartphone penetration drove first-time online buyers. These buyers are price-sensitive and brand-agnostic, making Flipkart the dominant platform for value-oriented products and local/regional brands. To capture this traffic effectively, sellers should consult a comprehensive flipkart keyword research and SEO optimization guide.
A Surat-based apparel brand shifted 40% of its Flipkart SKUs to the front page by optimising for Tier-2 city search terms like "cotton kurta under ₹500 Patna delivery." Their Amazon listings targeted urban search patterns. Result: 28% revenue increase without adding a single new SKU just smarter platform-specific keyword targeting.
Seller Competition: How Crowded Is Each Marketplace?
Both platforms have over 500,000 registered sellers. But the nature of competition is structurally different.
On Amazon.in, pricing behavior is the primary competitive weapon sellers who don't use real-time competitor price tracking lose the Buy Box within hours of a competitor repricing. Flipkart's competition is currently less algorithmically driven, but this is changing rapidly as more sophisticated sellers move onto the platform.
Buy Box Mechanics: Amazon vs Flipkart
The Buy Box (Amazon) and the "Add to Cart" default (Flipkart) are where sales are won or lost. The rules are different and most sellers apply Amazon logic to Flipkart, costing them significant revenue.
Amazon's A9 algorithm is ruthless about price. Being ₹50 above the category median on a ₹500 product can drop you off page one within 24 hours. Flipkart's algorithm is less aggressive price matters, but seller rating and fulfilment history carry more weight.
FBA (Fulfilled by Amazon) gives a significant Buy Box advantage on Amazon.in. Flipkart Fulfilment (FF) similarly boosts the Assured badge but self-fulfilled sellers with strong on-time delivery records can still compete effectively on Flipkart.
Both platforms weight seller metrics heavily. A competitor with 4.6 stars and 500 reviews can charge ₹150 more than you and still win the Buy Box on Flipkart. On Amazon, review velocity (new reviews per week) increasingly influences search rank.
When a top competitor goes out of stock, both platforms immediately reallocate visibility. Sellers who capture this window typically 3–5× conversion lift are the ones monitoring competitor inventory in real time.
Pricing Behavior: The Invisible Margin Killer
This is where most ecommerce marketplace comparison india guides miss the story. Commission fees are visible. Pricing behavior is silent and it's where most margin actually disappears.
Amazon: AI-Powered Repricing at Scale
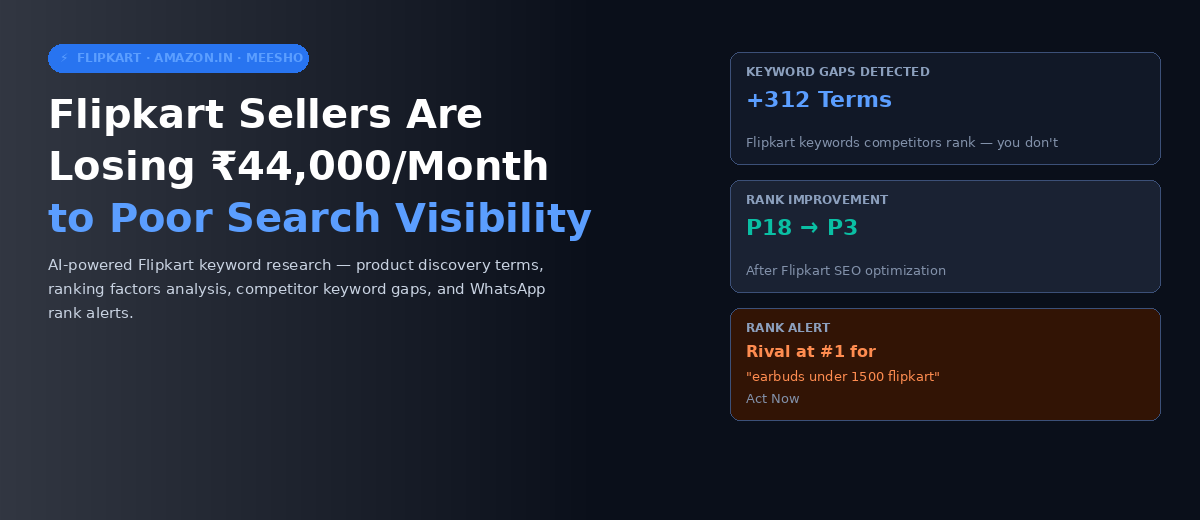
Top Amazon.in sellers reprice their entire catalogue every 15–60 minutes using tools like Insydz's competitor price tracking. A competitor who drops their price by ₹100 at 11 PM will have already recaptured the Buy Box before you wake up. Three weeks later, you've lost ₹45,000 in revenue you never even tracked.
Flipkart: Manual Repricing For Now
Flipkart's seller base is currently less sophisticated about repricing. The majority still manually update prices 1–2 times per week. This creates pricing windows moments where a seller who monitors competitor price movements can gain a temporary margin advantage without triggering a price war.
Flipkart's manual-repricing window is closing. As AI-powered seller tools become more accessible at ₹1,999–2,999/month, the repricing gap between Amazon and Flipkart will narrow to zero by 2027. Sellers who build real-time pricing systems now will have a compounding advantage.
Amazon Flipkart Profit Margins by Category: The Real Data
Choosing the right primary platform for each product category is the single highest-leverage decision most sellers aren't making deliberately, as amazon flipkart profit margins can drastically vary.
| Category | Better Margin Platform | Reason | Avg. Margin Delta |
|---|---|---|---|
| Electronics Accessories | Flipkart ✓ | Lower commission, less cross-border competition | +4–6% |
| Fashion / Ethnic Wear | Flipkart ✓ | Dominant traffic, lower commission fees | +5–8% |
| Home Décor | Amazon ✓ | Higher search intent, premium buyer profile | +3–5% |
| Kitchen Appliances | Amazon ✓ | Strong FBA logistics, higher AOV buyer | +4–7% |
| Books & Stationery | Flipkart ✓ | Significantly lower commission rate | +6–9% |
| Sports Equipment | Both | Roughly equal margin after ad costs | <2% |
| Beauty / Skincare | Flipkart ✓ | Lower commission, growing Tier-2 demand | +3–5% |
Track Prices on Both Platforms Free
Real-time Amazon.in & Flipkart price intelligence with AI Buy Box recommendations. Setup in under 30 minutes.
5 Mistakes Indian Sellers Make When Choosing Between Amazon & Flipkart
Copying the same listing, same pricing, same keywords across both platforms ignores fundamental algorithmic differences. What ranks on Amazon doesn't automatically rank on Flipkart.
Most sellers calculate commissions based on headline rates without accounting for category-specific tiers, festival surcharges, or fulfilment add-ons that can swing effective commission by 3–5%.
During Big Billion Days, Flipkart drives 40–60% of annual e-commerce revenue for many fashion and electronics sellers. Sellers who haven't built their Flipkart presence before October lose this window entirely.
Your top competitor on Amazon.in is often not your top competitor on Flipkart. Running the same price intelligence across both platforms means your data is always partially wrong.
Seasonal demand on Flipkart for fashion swings 40–60% during festive periods. A seller who doesn't adjust pricing dynamically for Diwali, Republic Day Sale, or Big Billion Days leaves significant margin on the table.
Best Practices: The Weekly Execution Model for Dual-Platform Sellers
The most successful Indian sellers don't manage Amazon and Flipkart reactively they run a structured weekly rhythm that keeps them consistently competitive on both platforms without doubling their effort.
- WhatsApp digest: top 3 competitor price moves on both platforms overnight
- Check Buy Box status for top 10 SKUs on each marketplace
- Act on any 'Critical Alert' (competitor dropped >10%)
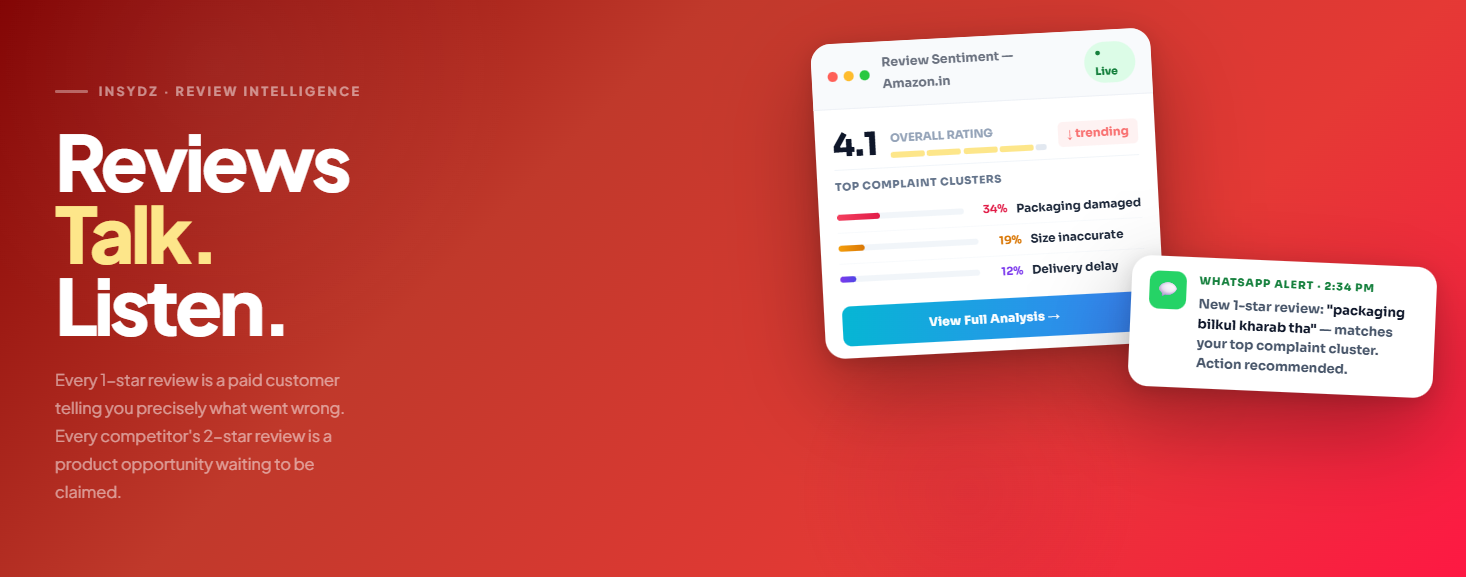
- Review platform-specific competitor review sentiment recurring pain points?
- Check keyword rank movements for top 5 keywords on each platform
- Identify OOS competitors (3–5× revenue window)
- Adjust 1–2 product prices based on AI recommendations per platform
- Audit commission effective rates for each SKU per platform
- Identify 1 new product gap from AI gap analysis report
- Review if any SKU should switch primary platform based on margin data
Best Tools for Amazon vs Flipkart Management in India (2026)
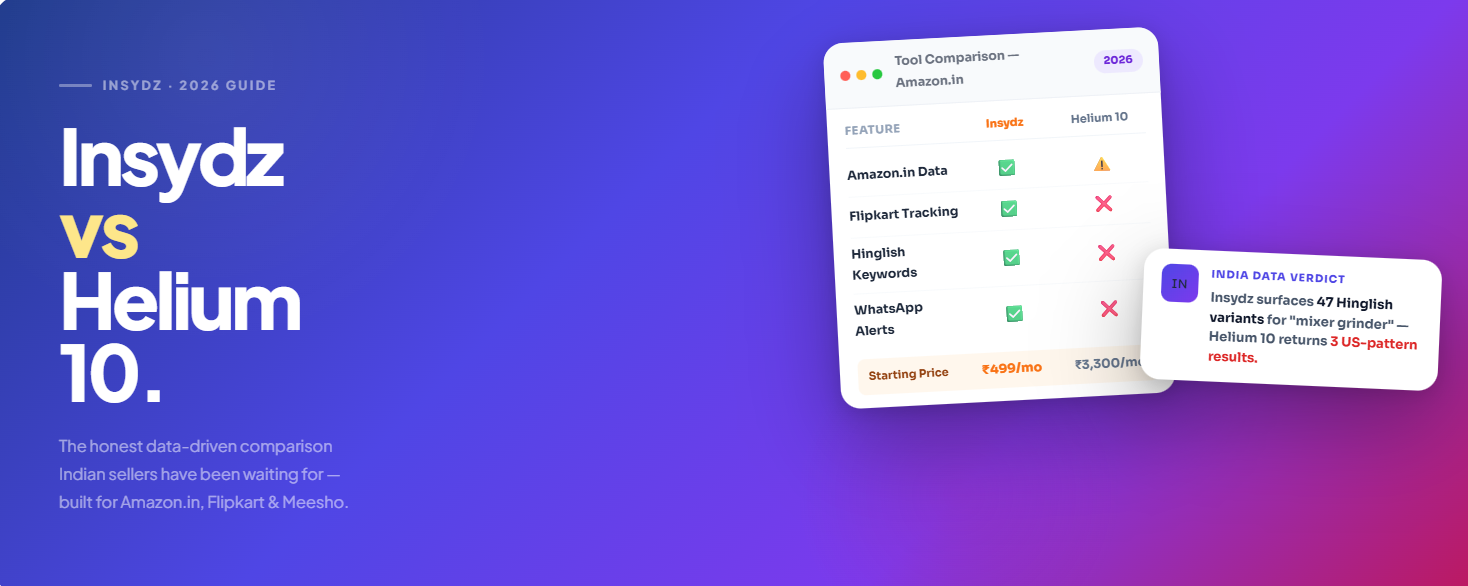
Global tools like Helium 10 and Jungle Scout cover Amazon.in but miss Flipkart entirely. For Indian sellers managing both platforms, you need a tool built for India-first dynamics. See our full Insydz vs Helium 10 comparison for a detailed breakdown.
| Tool | Amazon.in | Flipkart | WhatsApp Alerts | Price (INR/mo) |
|---|---|---|---|---|
| Helium 10 | Yes | No | No | ₹4,000–8,000/mo |
| Jungle Scout | Yes | No | No | ₹4,500–7,000/mo |
| Insydz ✦ | Yes | Yes | Yes | ₹1,999/mo + Free |
If you're an Indian seller on Amazon.in or Flipkart and you're not tracking competitor prices across both platforms, you're operating on guesswork. The question isn't whether you need a tool it's which one covers both marketplaces and fits your budget.
Frequently Asked Questions
For new sellers with limited budgets, Flipkart typically offers lower entry barriers lower commission fees in most categories, a less aggressive repricing environment, and strong Tier-2 demand. However, if your category has strong Amazon search traffic (home, kitchen, or premium electronics), launching on Amazon first can build reviews faster through higher volume.
Final Thoughts
Winning on Amazon India and Flipkart in 2026 isn't about picking a side it's about deploying the right strategy on the right platform for the right product. Commission fees matter. Search traffic matters. Seller competition matters. But what matters most is whether you're reacting to pricing behavior or leading it.
Sellers who treat both platforms as interchangeable will keep losing margin silently. Sellers who build platform-specific intelligence tracking competitor prices, review velocity, and Buy Box movements separately for each marketplace are the ones who scale consistently through festive seasons and category shakeouts.